Answers today, not next week
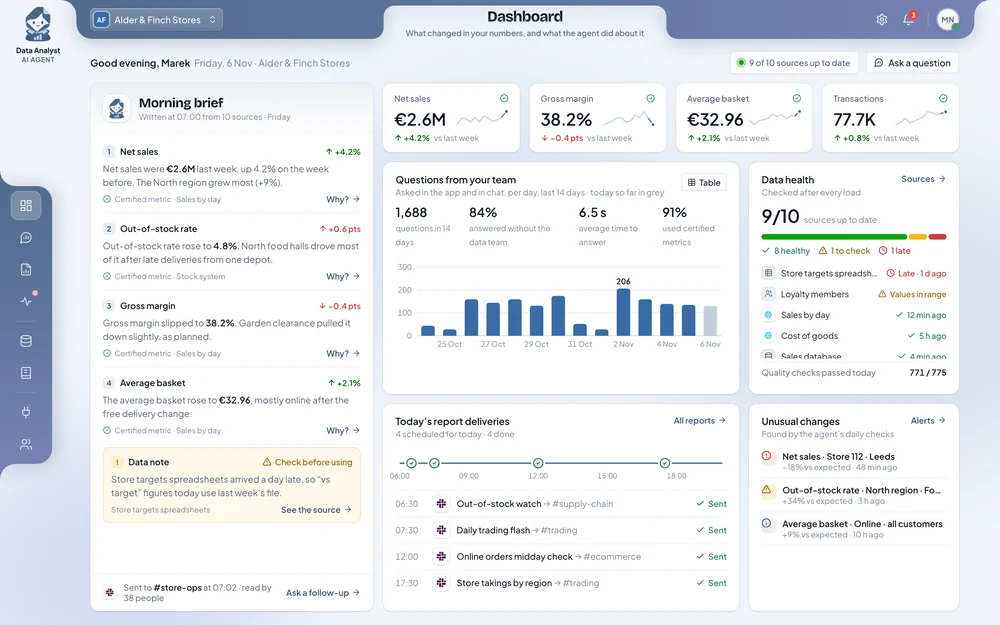
Managers ask in plain words and get the number, a chart and a short explanation in seconds, without joining the reporting queue.
 Data Analyst AI Agent
 answers your managers’ questions in plain words, straight from your data warehouse and ERP, with the chart and how each number was calculated. Decisions are made on current figures instead of last month’s report, and each person sees only the data they are already allowed to see.
40 s
from question to answer
78%
of questions answered without the data team
−60%
ad-hoc requests to the data team
Managers ask in plain words and get the number, a chart and a short explanation in seconds, without joining the reporting queue.
When a number moves, the agent finds which regions, products or customers caused it and alerts the people responsible the next morning.
Every answer uses the same agreed definitions and shows which data it used, so teams stop arguing about whose figure is right.
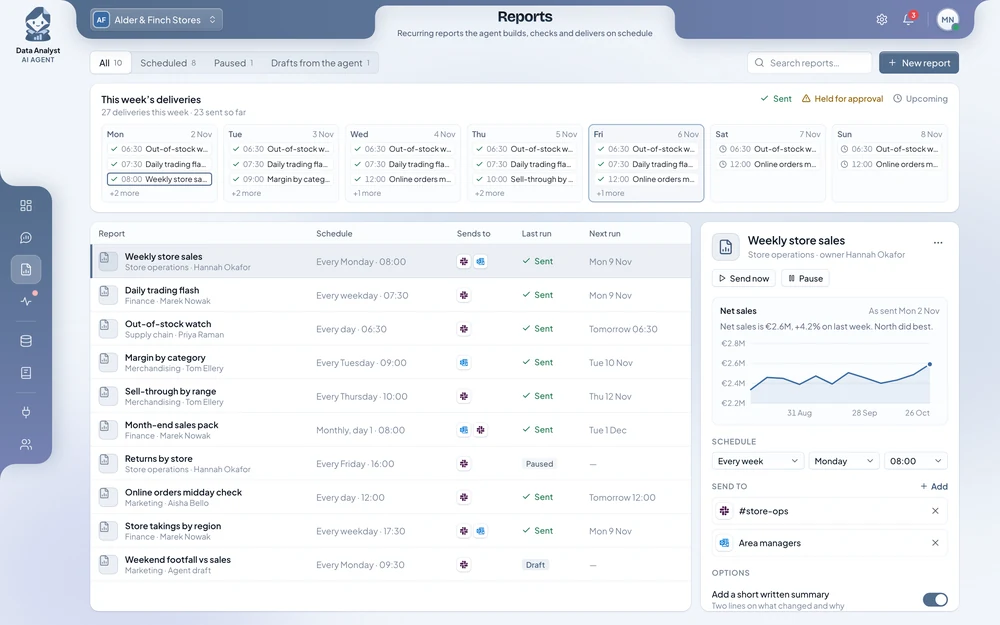
A report is set up once from a plain request, checked against the data each time and delivered on schedule to the people who need it.
A sales operations manager asks how margin changed by region. The agent reads the figures from the data warehouse and the ERP, finds what drove the change and attaches the chart and the calculation. It then offers to send the same view every week.
Sales operations managerHow did margin by region change last quarter?
Data AnalystGross margin fell from 34% to 31% in the DACH region, mainly because freight costs rose 18%. Iberia improved by 2 points. The chart and the calculation are attached. Shall I send this to the regional leads every Monday?
Each one in short: the problem, the results, and how the agent handles the work.
An area manager who wanted to know why a region was behind plan raised a ticket and waited about two days.
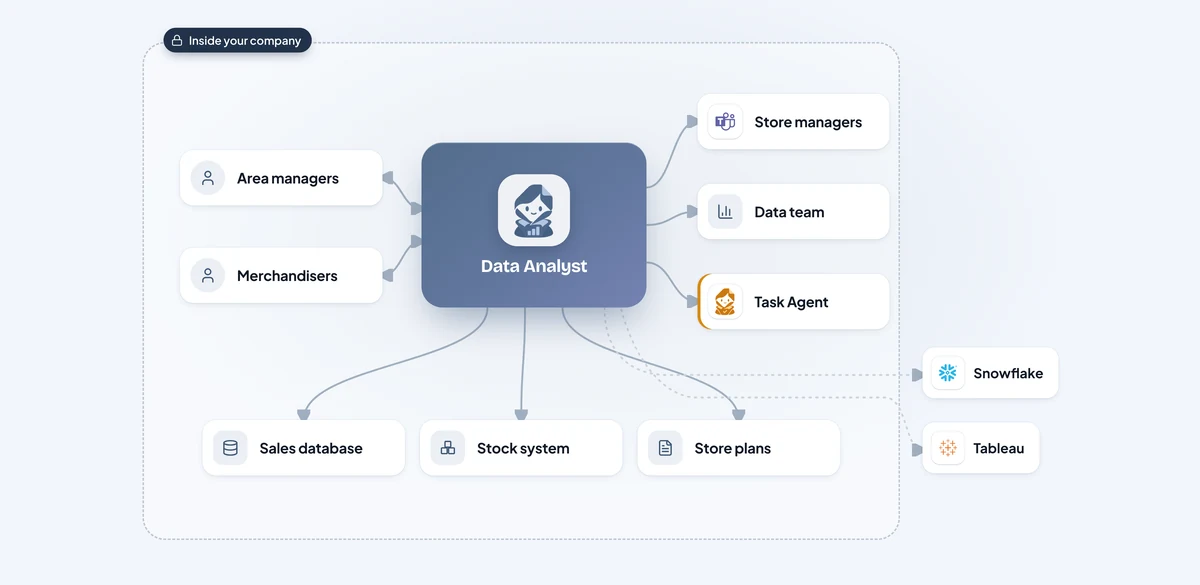
Emma, an area manager, asks in Microsoft Teams why the North region is behind plan.
It takes "net sales" from the metrics catalogue, exactly as Finance certified it, so Emma's answer matches the finance report to the euro.
It reads 1.4 million till receipts in the sales database, the November plan from the store spreadsheets, stock levels from the stock system and the same weeks last year from the warehouse.
Emma gets a short answer, a chart of the stores furthest behind and the steps the agent took: which data, which definition, which filters.
When unpaid bills jumped 9% in October, explaining it took a billing analyst about three days: exporting data from four systems into Excel, matching customers by hand and writing a commentary for the month-end pack.
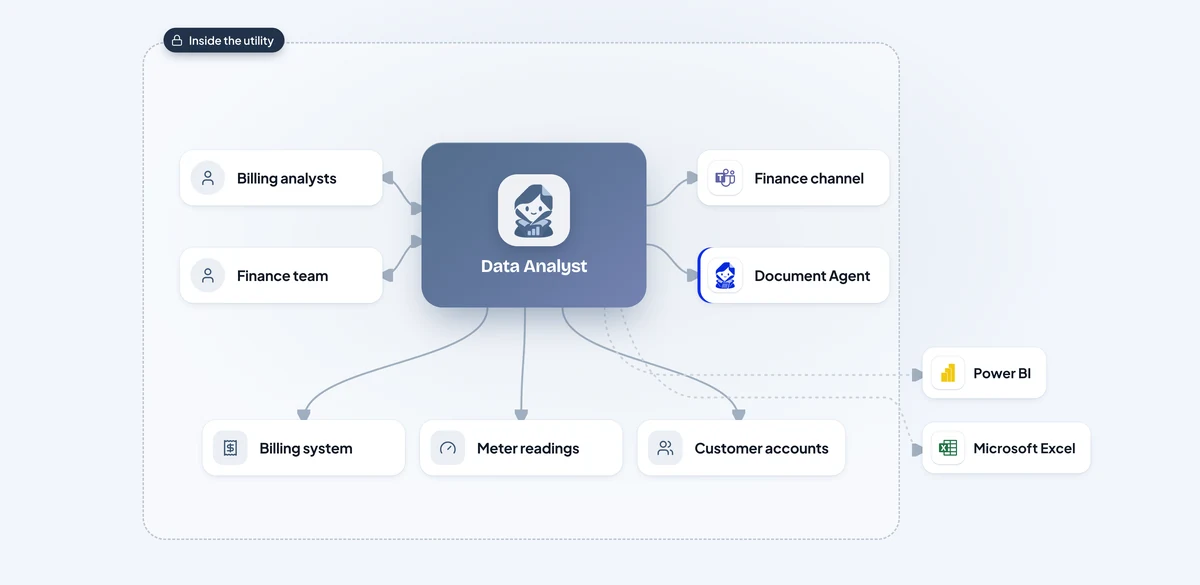
Marta, a billing analyst, asks in Microsoft Teams: "Why did unpaid bills rise 9% in October?" The agent finds the certified definition of unpaid bills and the two month-end figures it needs to explain.
It compares September and October customer by customer and groups the difference by cause: estimated bills after missed meter reads, payment plans that ended, the October price change and customers moving to direct debit.
Each step of the waterfall shows the internal system it came from, and the agent checks that the drivers add up to the total in the Power BI finance report.
Marta gets a short written explanation with the waterfall chart.
Each bed manager spent about six hours a week copying figures from the bed management system, the patient administration system and the theatre schedule into spreadsheets.
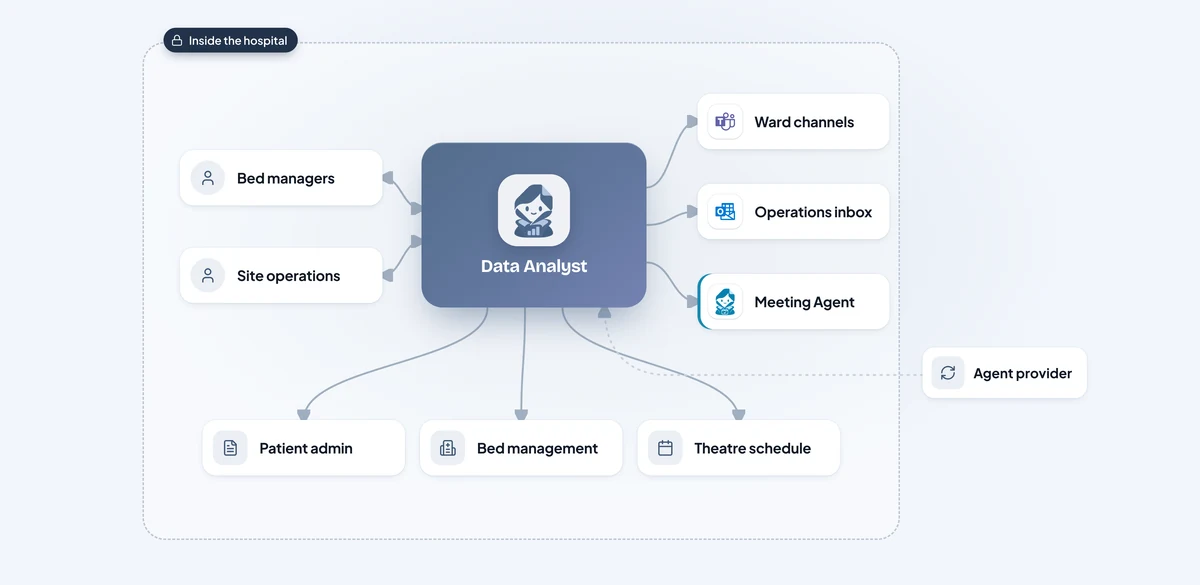
Grace, a bed manager, writes in Microsoft Teams: "Every morning at 6:30, send the bed census by ward to the bed managers' channel." The agent works out which figures that needs and where they live.
It joins beds free, occupied and closed from the bed management system with today's admissions from the patient administration system, and sends Grace a preview with the steps it took.
When Grace approves the preview, the report joins the hospital's schedule.
Each report arrives in its Teams channel or Outlook inbox on time, with an Excel file where staff want one.
Twelve marketers shared two analysts.
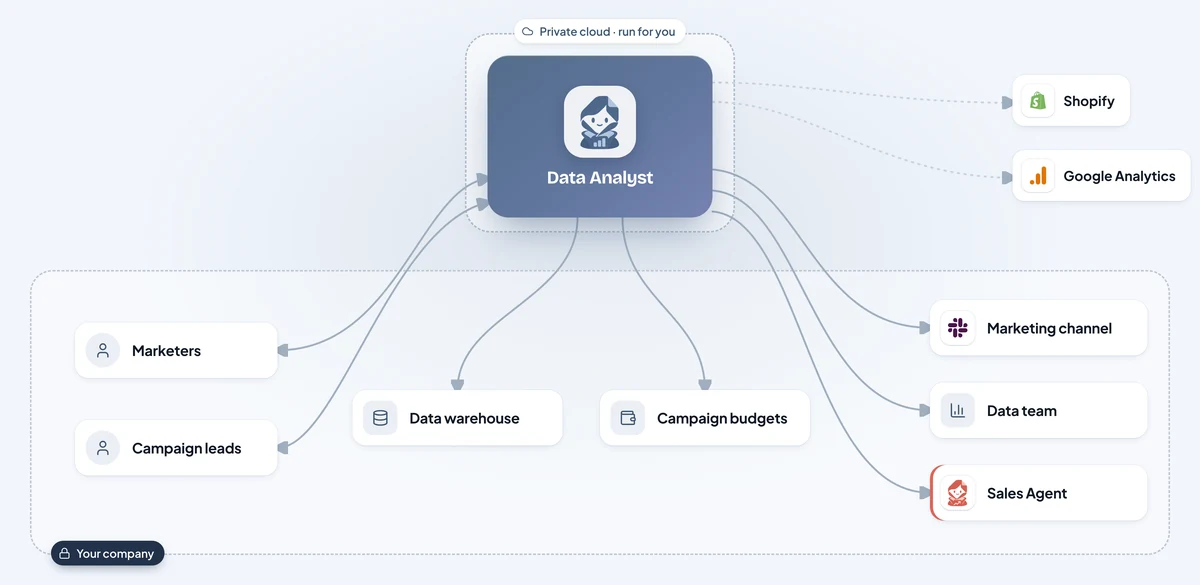
Lena asks in Slack which campaigns brought the most first orders in October and what each one cost.
It takes orders from Shopify, the campaign behind each first visit from Google Analytics and the spend from the budget sheet, and counts first orders the way the metrics catalogue defines them.
In 38 seconds Lena has a short answer, a bar chart by campaign channel and a "how I got this" note listing every source and definition, so she can check it or forward it with confidence.
When Lena asks for the chart every Monday, the agent schedules it in #marketing-data.
Production data arrives overnight from the production database, the quality inspections system and shift spreadsheets kept on the file share.
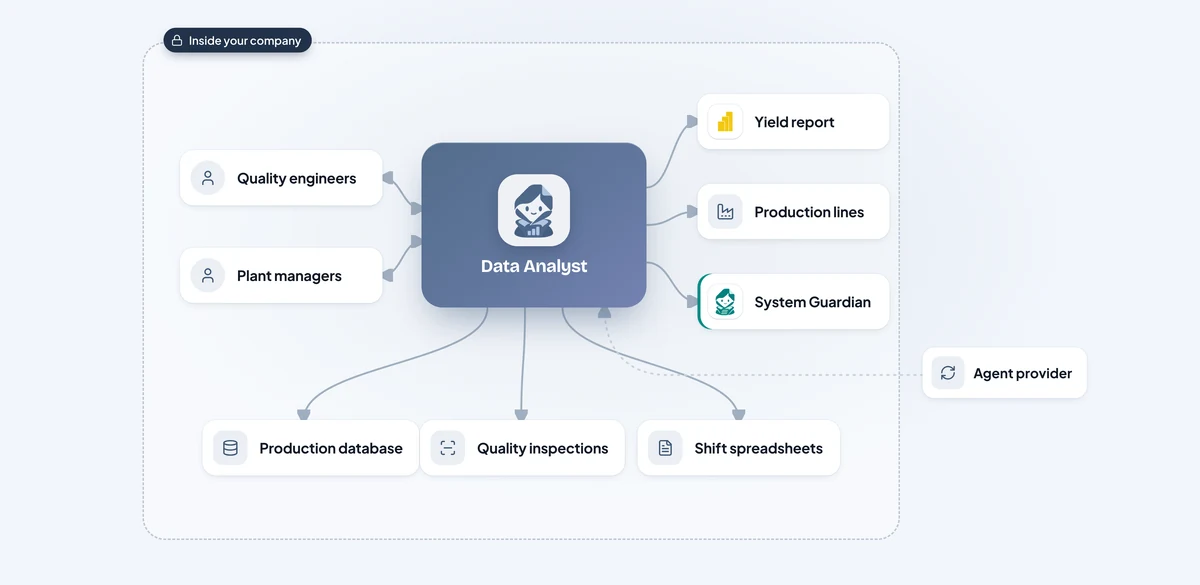
Every line's data passes the five checks, one after another, between 02:00 and 03:00, long before the report is built.
Line 3 stops at "sensor values in range": oven 3B read 0 °C for 47 minutes when it normally runs at 182-196 °C.
At 03:05 the quality engineer receives a message in Microsoft Teams with a small chart of the gap and two choices: exclude the 47 minutes or release the data as it is.
The 06:30 Power BI report goes out with lines 1, 2 and 4.
Fuel cost per km moves for many ordinary reasons: routes, weather, seasonal volume.
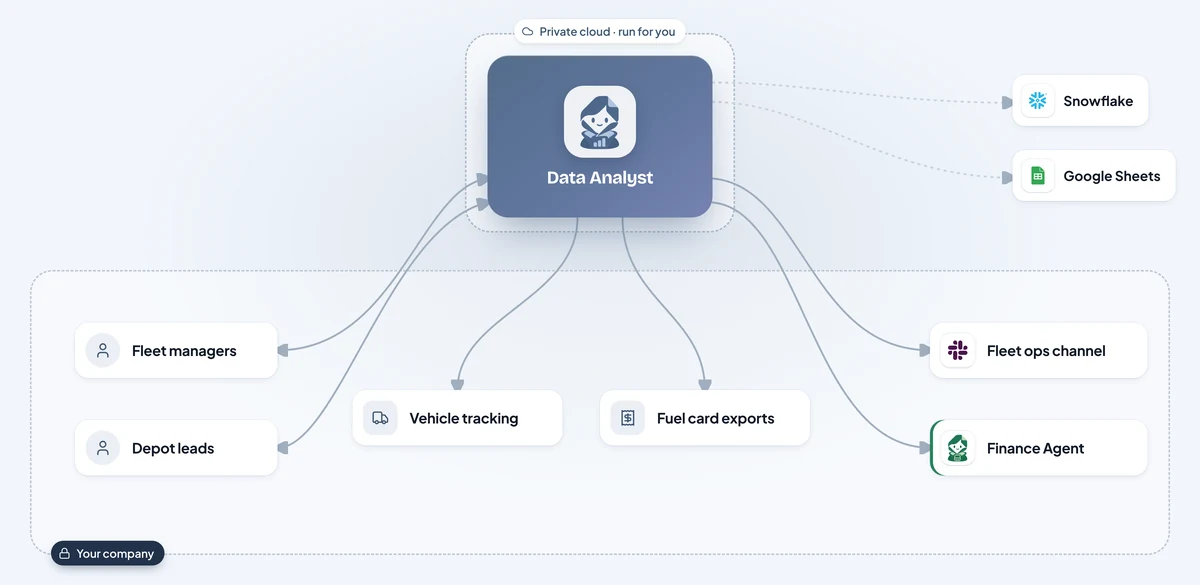
At 06:30 the agent compares yesterday's fuel cost per km at each depot with its expected range.
Before raising anything, it checks that the fuel card export arrived on time, that all 42 vans reported their kilometres and that the price per litre did not change.
It breaks the extra cost down: two vans idled 6.5 hours a night, one fuel card was used twice on the same day, and a road-works diversion added 11 km to one route.
The alert lands in #fleet-ops in Slack with the chart and the reasons.
Illustrative scenarios with unnamed companies. The figures show the kind of improvement each setup is designed to deliver; actual results depend on volume, the systems connected and how the agent is configured.
We set up the Data Analyst AI Agent around how your data team and the managers it serves work today.
Week 1
We sit with the people who do the work, map the process step by step and find the systems that hold the information. You get a written plan before anything is built.
Weeks 2 to 3
We build and configure the agent around your process: your rules, your approvals, your wording, and connections to your databases and the tools your teams use.
Weeks 3 to 4
We install it inside your infrastructure, or in our cloud if you prefer, and test it with your team on real requests until the results meet the standard you set.
From week 5
We train your employees and administrators, hand over the controls and stay with you: monthly reviews, updates you approve, and the next process when you are ready.
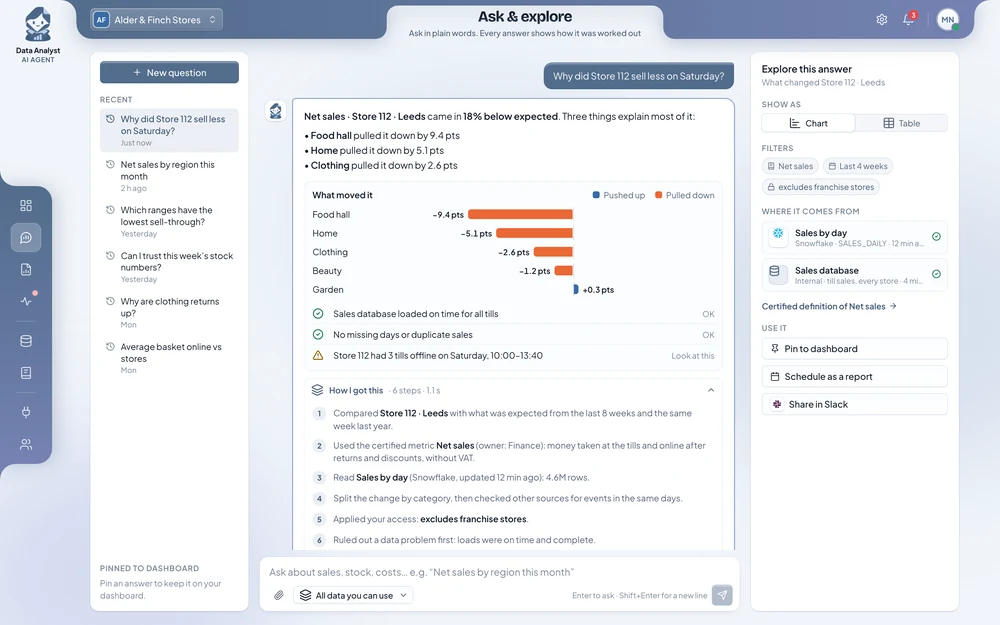
Your managers ask real questions within the first weeks. Most companies see fewer requests reaching the data team, and faster answers, during the first month after going live.
It depends on how many people use it, the data sources it connects to and where it runs. After a first conversation you get a written proposal with the price, so you can compare it with what reporting costs you today.
It takes over the repeat questions and routine reports, so your analysts spend their time on forecasting, testing and deeper analysis. Definitions, data quality and the answers that matter most stay with your people.
Every answer shows which data it used and how it was calculated, so analysts can check it. It uses only the definitions your team has agreed, and it warns you when a source is late or incomplete instead of answering from bad data.
Yes. You decide which sources it reads, which reports it may send alone and which need a person’s approval first. You can pause it at any time.
It can run on your own servers, with its AI models, so sales, finance and customer data stay inside your company and no outside AI service sees them. We have no access to it, and your data is never used to train AI models.
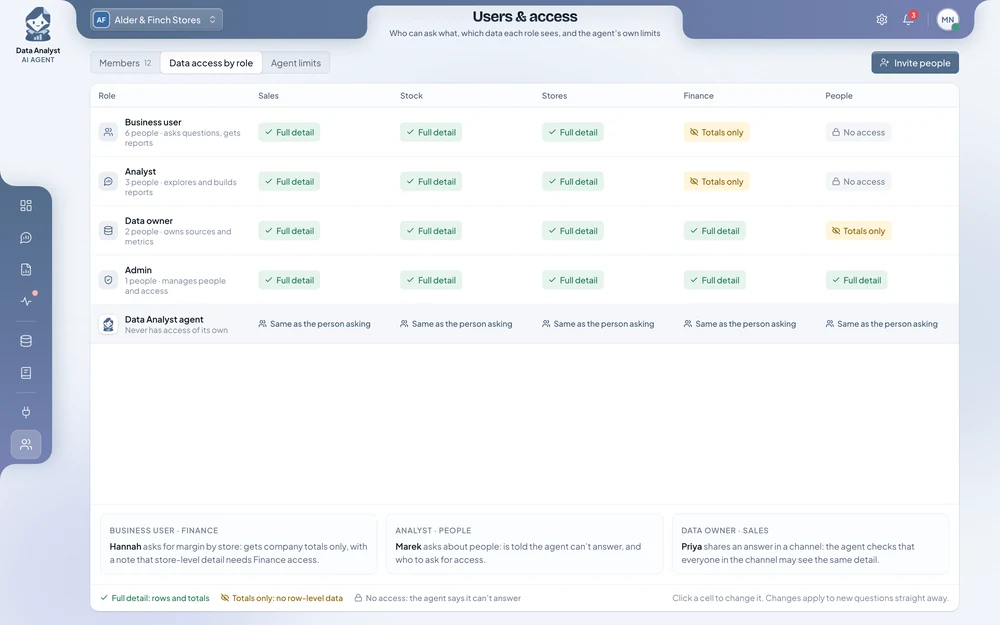
Each person only sees the data they are already allowed to see. The agent has no access of its own: it uses the rights of the person asking, and checks that everyone in a shared channel may see the same detail.
No. It works with your data warehouse, such as Snowflake or BigQuery, or directly with your ERP, databases and spreadsheets. It works alongside Tableau, Looker and Power BI and can point to the right dashboard.
One person who knows your data and how reports are used today, access to test versions of the sources involved, and a few hours a week from the data team while we test.
Yes. Most companies start with one team or one subject, such as sales or month-end figures, see the results, and then extend the agent to other teams.
Tell us which questions reach your data team most often, where the data lives and who needs which figures. You get a written proposal with the expected results, the setup, a timeline and a price.